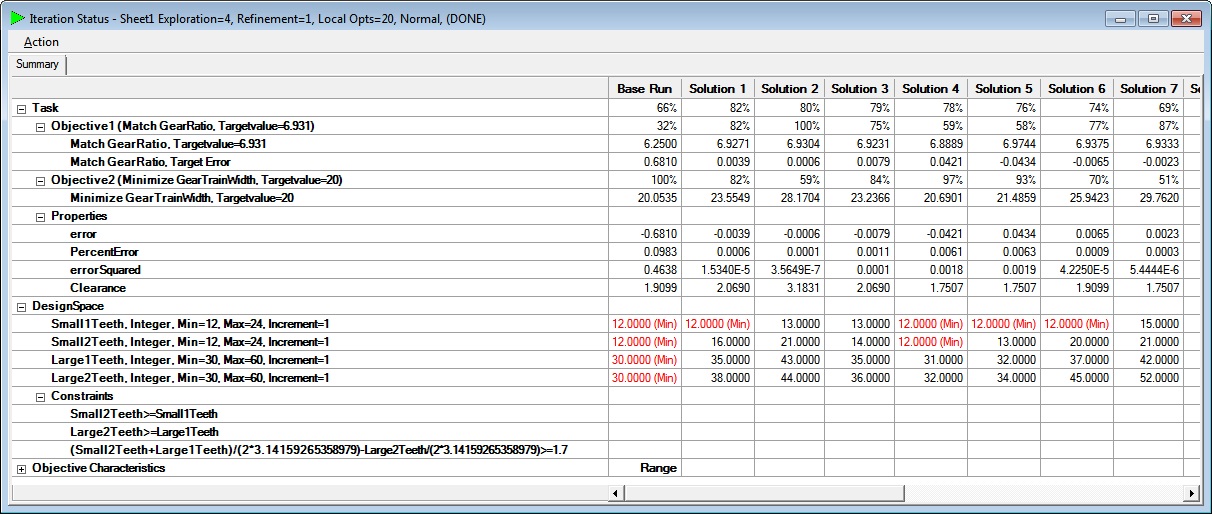

The Summary Tab displays the results of an Iteration in a hierarchical tabular format. It has a grid consisting of rows and columns that are described below. If no other tab is applicable to the Iteration, the Summary Tab is not displayed; only the grid is displayed.

The Iteration Status window has a number of collapsible rows.
The Task row displays the weighted average of each Objective of the run. All Objective values range from 0% (worst case) to 100% (best case). The better the solution, the higher the Objective.
Each Objective row displays the value of the Objective component of the Objective.
Each Objective Value row contains the cell value after evaluating with the DesignSpaceVariable values from the DesignSpace rows.
Each Variable row contains the cell value associated with the DesignSpaceVariable that was used to obtain the value in the associated Objective Value rows.

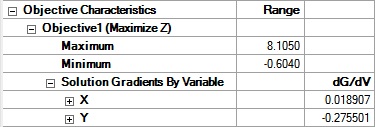
There are Minimum and Maximum Objective value rows as well as a Solution Gradient row for each DesignSpaceVariable. A Solution Gradient is the partial derivative of an Objective value with respect to a DesignSpaceVariable value.
The first column contains the Row Titles. The first data column is the Base Run, and the subsequent columns are the various solutions found, in descending order by Objective value. Only the solutions that were found will be displayed not the number requested.
The Base run is the run produced by the starting values.
Each solution is listed in descending order by Objective value. Only the solutions that were found will be displayed which may be less the number requested.