
A Pareto Analysis Tab is displayed after you click the OK button on the Pareto Options dialog. A Pareto Analysis tab is a grid of rows and columns and a graph that may be exported to an Excel sheet.
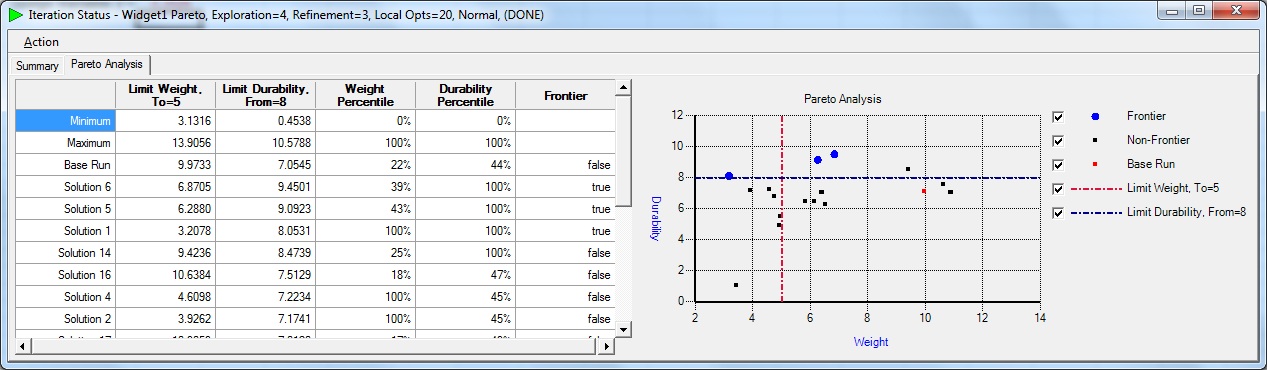
The first row of the Pareto Analysis Tab consists of Column Headings.
The next two rows of the Pareto Anaysis Tab contain the Minimum and Maximum value for each column.
After the Maximum row, the Pareto Analysis Tab displays rows for Solutions that are on the Pareto Frontier in order from best Y value to the worst Y value as determined by the Y percentile value.
After the Pareto Frontier rows, the Pareto Analysis Tab displays rows for Solutions that are not on the Pareto Frontier in order from best Y value to the worst Y value as determined by the Y percentile value.
The first two columns of the Pareto Anaysis Tab contain X and Y Objective values.
The next two columns of the Pareto Anaysis Tab contain X and Y Objective percentile rankings.
After the percentile ranking columns, the Pareto Analysis Tab displays error column(s) for Match Objectives.
Finally, the Pareto Analysis Tab displays a column that indicates whether a particular row represents a Solution that is on the Pareto Frontier.
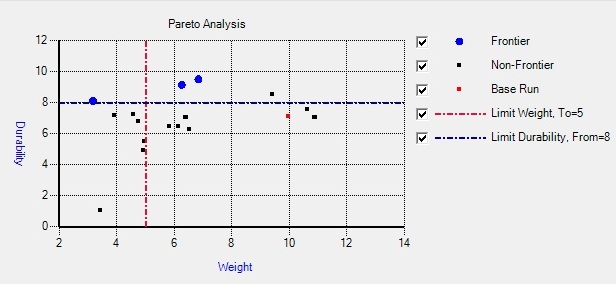
The Pareto Graph plots Frontier, Non-Frontier and Base Run points for the selected Objectives. In addition, it plots reference lines for any limits, bands or match values specified by the Objectives. The graph includes a legend entry for each set of points that includes a checkbox that toggles the visibility of the associated set of points.